Unlock Results: Get the Most from Your Marketing Campaigns
November 11, 2024
Unlock Success: Your Guide to Marketing Analytics
November 26, 2024Understanding how to turn data into insights can elevate your marketing strategy and give your business a competitive advantage. Using data visualization and predictive analytics helps you see both the big picture and future trends. Let’s explore how these techniques work and how they can help you understand your target audience better, refine your data collection methods, and make more informed decisions.
What is Data Visualization?
Data visualization transforms raw information into visual content like charts, graphs, and dashboards. Instead of sifting through complex numbers, you can see a visual story that highlights important patterns and data points. This makes it easier for decision-makers to spot opportunities, improve customer satisfaction, and optimize marketing campaigns.
Tools for Data Visualization
- Tableau: Ideal for creating interactive dashboards and tracking various types of data. It helps you see patterns in marketing data analytics.
- Google Data Studio: A user-friendly tool that’s perfect for combining demographic information from multiple sources, making it easy for market research and small businesses.
- Power BI: Known for its real-time updates and customized visuals, Power BI is great for collaborative reporting and tracking customer interactions.

These tools help you collect and analyze data from different sources, making it easier to understand customer behavior and design strategies that align with your business strategy.
The Power of Predictive Analytics in Marketing
Predictive analytics takes data from the past and uses it to forecast future outcomes. By applying techniques like regression analysis and clustering, you can predict changes in customer behavior and adjust your marketing strategy accordingly. It’s all about staying ahead of the game and making proactive adjustments.
How Predictive Analytics Works
Predictive analytics uses different data collection methods like surveys and focus group analysis to gather information and build models. These models answer questions like:
- Which products or services are most likely to attract loyal customers?
- What pain points are turning potential customers away?
- Which customer interactions are the most effective in building customer relationships?

By using these insights, marketing teams can create more effective marketing campaigns, ensuring they resonate with both existing customers and new prospects.
Common Predictive Models for Marketing
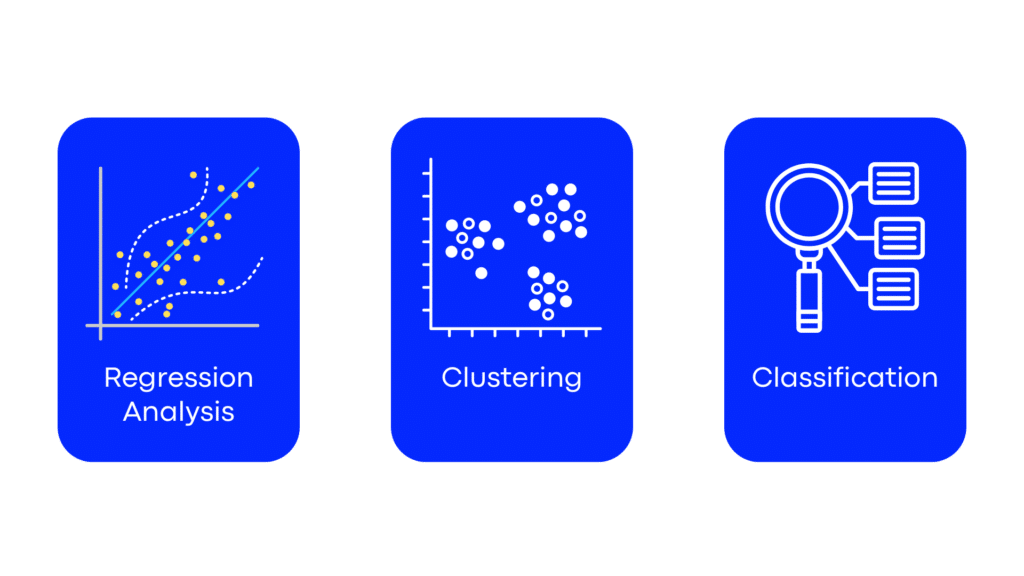
- Regression Analysis: This model helps you find relationships between variables, such as how changes in ad spend impact sales. It’s useful for understanding what drives purchase decisions.
- Clustering: Clustering groups your customers based on shared traits. This is useful for market segmentation because it lets you design specific campaigns for different groups of people, like “budget shoppers” versus “high-value customers.”
- Classification: This model predicts which category a new customer will fall into, such as classifying leads into “likely to buy” or “unlikely to buy.” This allows you to focus your resources on high-value opportunities.

Why Combine Data Visualization with Predictive Analytics?
When you combine data visualization and predictive analytics, you get a complete view of your customer journey. Here’s why:
- Identify Patterns Easily: Visualization tools make it easy to spot trends and changes in customer experiences or demographic information.
- Forecast Future Trends: Predictive models use these patterns to forecast future outcomes, giving you a better strategy for product or service launches.
- Informed Decision-Making: By seeing what’s happening and what might happen, marketing teams can refine their strategies, making every campaign more effective.

Key Takeaways
- Simplify Data with Visualization: Tools like Tableau and Google Data Studio make raw data easy to read, providing valuable insight into your target audience.
- Leverage Predictive Models: Use regression, clustering, and classification techniques to anticipate shifts in customer behavior.
- Make Data-Driven Decisions: Combining both approaches helps you refine your marketing strategy and improve customer satisfaction.
With these techniques, you’ll be able to turn complex marketing data analysis into actionable insights, helping you connect with your customers, improve your product features, and build a business strategy that’s both proactive and effective.


